For executives and finance
Revenue at risk
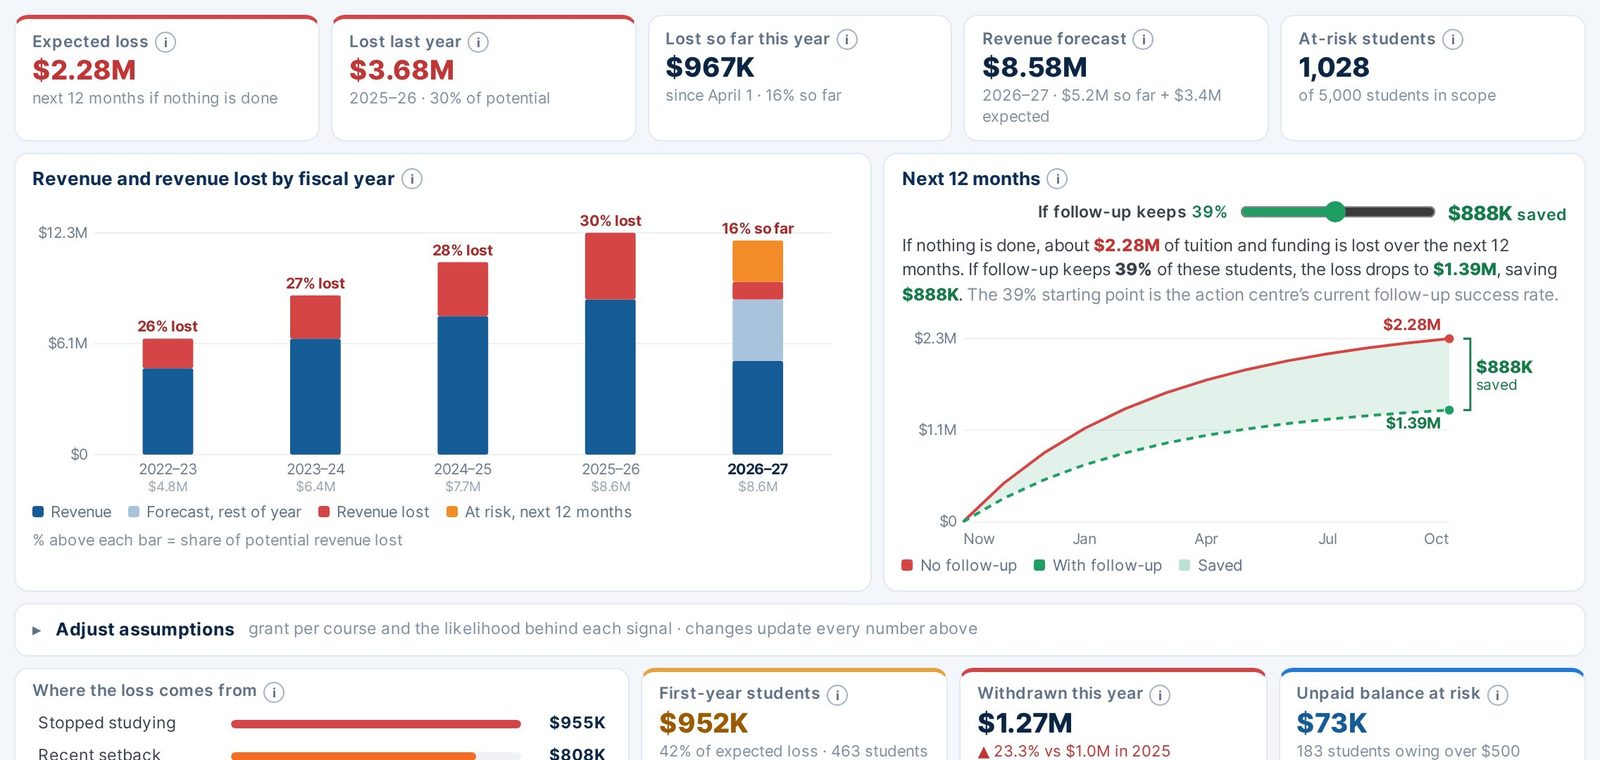
Know how much tuition and funding is at risk over the next 12 months, where the loss comes from, and how much follow-up could save.
- Expected loss, with and without follow-up
- Revenue and revenue lost in each fiscal year
- Where the loss comes from, signal by signal
- Every assumption visible and adjustable
How it works: Each at-risk student is counted once, under their strongest signal, and the tuition and funding at stake are weighed by how likely that signal is to lead to leaving.